

Получить 25% скидки
Пожалуйста, ответьте на несколько вопросов и получите купон со скидкой 25% на модель ФинРобота!
Quick RE Development Model: 3. Working off-line in Excel
Paid for version of the Quick RE Development Model provides additional functionality and analysis which are not available in a free version – please read below for further details. The free version will have these disabled and marked with blue shaded background.
Both free and purchased versions allow changes to certain non-structural variables and assumptions entered during on-line assembly stage as described below. Such input areas are marked with yelled background in the Excel file of the Model. You can re-populate these with your own data without any risk of altering the structural layout of the Model.
In this area of the Model you can change business assumptions related to your project. The Model will take care of the rest and will run your data through formulae and into the output fields and graphs.
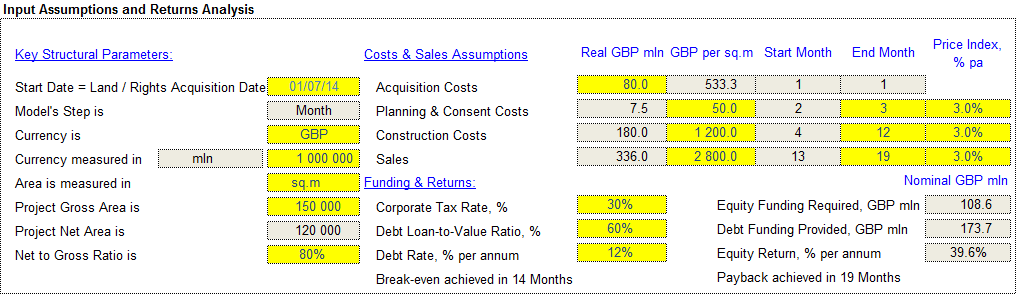
An example of the Input Assumptions and Analysis’ box is provided below.
Full version:
Free Version (disabled options shown with blue background):
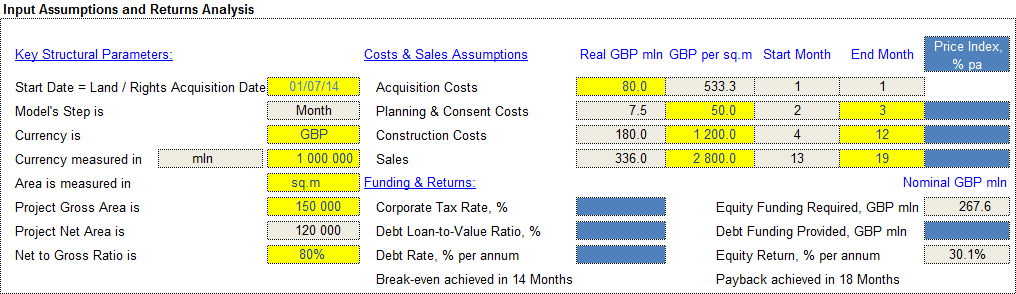
As you can see from the above screenshots, input area labelled ‘Key Structural Parameters’ holds data from Step 1 of the online assembly whilst ‘Costs & Sales Assumptions’ area captures data entered during Step 2. Yellow fields denote inputs you can re-populate without any concerns to structural integrity of the Model. Please refer to sections 2.1 and 2.2 of the Manual for description of these input items.
In addition to inputs captured during on-line assembly Full version allows user to apply price index to their investments and sales. Indexing can be achieved by applying values to column ‘Price Index, % pa’. Note that irrespective of your Model’s step price index is expressed in annual terms. Once the values are booked the Model will take care of the rest by applying correct inflation adjustment to relevant time periods of your Model.
The last area of the ‘Input Assumptions and Return Analysis’ box is labelled ‘Funding and Return’. Some of it is disabled in the free version of the Model save for -
|
Input field |
Comment |
|
Equity Funding Required |
Adds up all input costs for the project funded by equity. As free version of the Model does not have any debt leverage assumption Equity Funding Required amount equals funding requirements for the project as a whole. |
|
Equity Return, % per annum |
This is the end result of all calculations done by the model. Similar to Equity Funding Required above equity return and total project return would be the same in free version of the model. |
|
Breakeven in [Months] |
Finds a period when cash flow break-even is achieved based on inputted assumptions |
|
Payback in [Month] |
Calculates break-even period when cash flow to equity turns positive on cumulative basis |
Please refer to the following section of the manual to read more on additional functionality of the paid version of the Model.
With reference to free version full version of the Model provides additional functionality as outlined in the table below:
|
Input field |
Comment |
|
Price Index, % pa |
Apply price index or inflation factor to investments and sales assumptions. Note that irrespective of your Model’s step price index is expressed in annual terms. Once the values are booked the Model will take care of the rest by applying correct inflation adjustment to relevant time periods and line items of your Model. |
|
Corporate Tax Rate, % |
Assumes that sale proceeds net of investment costs and interest charges would be taxed at this rate. To keep your project analysis at pre-tax level keep assign value of zero |
|
Debt Loan-to-Value Ratio, % |
By applying an LTV assumption expressed in % of total funding requirements the Model will start drawing on debt facility at set LTV % when funds are required during acquisition, planning and construction phases. Other things equal the higher the LTV ratio is the higher IRR equity providers should expect. |
|
Debt Rate, % per annum |
This is the cost of debt facility. Note that if LTV is set to %, then it does not matter what value is assigned to the cost of debt. Rate is expressed in per annum terms irrespective of the Model’s step. |
|
Debt Funding Provided |
Calculates total funding provided by debt facility. Note that availability of debt would not reduce equity funding required dollar for dollar due to interest charges |
The cash flow graph immediately below shows payment profile to equity. Note that if you apply leverage certain projected periods would show zeros during the sales phase. This is because the Model assumes debt repayment to be a priority. Once debt is repaid with interest remaining of proceeds from sales (net of tax charges) are distributed to equity.
The Model's calculations area is located below the Cash Flow graph. The end of the calculations area is marked with -
|
>> End of Sheet |
Users are not required to alter any of the formulae in this area. However, there are no hidden lines or complicated formulae. If you feel comfortable with the data flow in these rows, you can adjust the logic to better suit your project’s environment as you see fit.
Note that free version of the Model will have paid for functionality disabled but not erased. You will see block of cells marked with blue background.